Data Visualization Introduction
🎧 Focus sounds
Soft beat sounds that many learners like while reading. Pick one, press Play, and keep studying.
Keep the volume low. These sounds are for comfort while studying, not a medical treatment. If you have epilepsy or are sensitive to pulsing sounds, use the background noise only.
In this lesson
A table of 1,000 numbers hides its story. A chart shows it in two seconds: the trend going up, the one month that crashed, the outlier nobody noticed. Data visualization is the skill of turning numbers into pictures that answer a question.
In Python, the two libraries you’ll use are:
- Matplotlib: the original plotting library. Full control over every line and label.
- Seaborn: built on Matplotlib. Beautiful statistical charts from a DataFrame in one line.
pip install matplotlib seabornPick the chart from the question#
The most common mistake is choosing a chart because it looks nice. Start from your question instead:
| Your question | Chart |
|---|---|
| How does something change over time? | Line chart |
| How do categories compare? | Bar chart |
| How are values spread out? | Histogram, box plot |
| Are two numbers related? | Scatter plot |
| What share does each part make of the whole? | Stacked bar (or a pie, for 2–4 parts only) |
| How do many numbers relate to each other? | Heatmap |
If you can’t say what question your chart answers in one sentence, it’s not ready. Write the question as the chart’s title.
Your first chart#
import matplotlib.pyplot as plt

months = ["Jan", "Feb", "Mar", "Apr", "May", "Jun"]
visitors = [1200, 1350, 1100, 1800, 2400, 2900]

plt.figure(figsize=(7, 4))
plt.plot(months, visitors, marker="o")
plt.title("Website visitors are growing fast since April")
plt.xlabel("Month")
plt.ylabel("Visitors")
plt.show()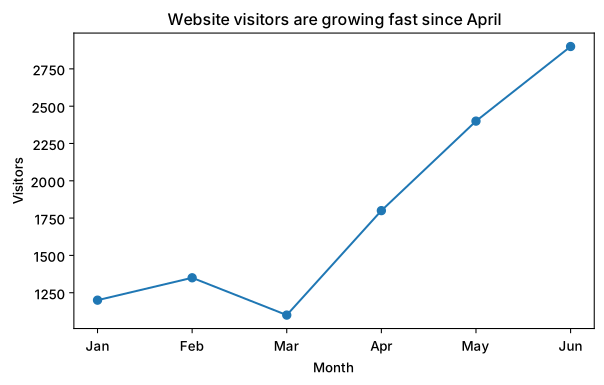
plt.show() displays the chart. In Jupyter or Colab, charts appear right under the cell.
The parts of a Matplotlib chart#
Every chart has the same anatomy, and knowing the names helps when you search for “how do I change…”:
- Figure: the whole picture, like the paper.
figsize=(7, 4)is its width and height in inches. - Axes: one chart area inside the figure, with its own x-axis and y-axis. A figure can hold several axes (subplots).
- Title, labels, ticks, legend: the text that tells readers what they’re looking at.
There are two ways to write Matplotlib code. The quick plt. style above, and the object style, which is clearer when you have more than one chart:
import matplotlib.pyplot as plt

fig, ax = plt.subplots(figsize=(7, 4))
ax.plot(["Jan", "Feb", "Mar"], [10, 14, 9], marker="o")
ax.set_title("Orders per month")
ax.set_ylabel("Orders")
plt.show()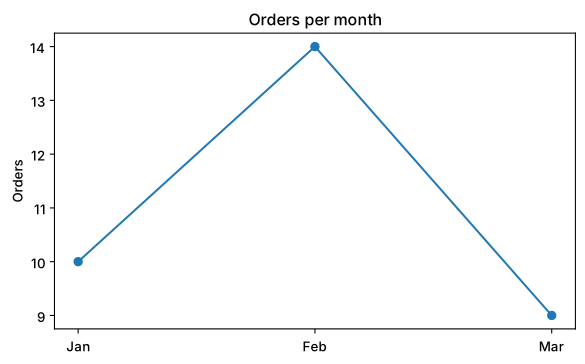
fig is the figure, ax is the axes. Methods on ax start with set_ for labels and titles.
Saving charts#
plt.savefig("visitors.png", dpi=150, bbox_inches="tight")Call savefig before plt.show(). bbox_inches="tight" trims empty margins, and dpi=150 gives a sharp image for reports and slides.
Quick check
You want to show how a student’s marks changed across 5 exams. Which chart? A line chart, because the x-axis is time (exam 1, 2, 3…).
Summary#
- Choose the chart from the question: time → line, categories → bar, spread → histogram, relationship → scatter.
- A Matplotlib figure holds one or more axes (charts).
- Always add a title and axis labels; save with
plt.savefig.
Quick quiz
3 questions. Check what stuck and earn 2 XP for each right answer.
Progress is saved in this browser. Create a free account to keep it on every device.
Get new lessons in your inbox
One email when we publish a new tutorial or guide. No spam, unsubscribe in one click.