Relationships and Heatmaps with Seaborn
🎧 Focus sounds
Soft beat sounds that many learners like while reading. Pick one, press Play, and keep studying.
Keep the volume low. These sounds are for comfort while studying, not a medical treatment. If you have epilepsy or are sensitive to pulsing sounds, use the background noise only.
In this lesson
Before building a machine learning model, data scientists look for relationships: which columns rise and fall together? Seaborn makes that exploration fast. This lesson covers scatter plots with a trend line and the correlation heatmap, a chart you’ll see in almost every data science notebook.
import numpy as np
import pandas as pd
import seaborn as sns
import matplotlib.pyplot as plt

rng = np.random.default_rng(11)
n = 150
area = rng.uniform(500, 2500, n)
rooms = np.clip((area / 550 + rng.normal(0, 0.7, n)).round(), 1, 6)
age = rng.uniform(0, 30, n).round()
price = (2500000 + area * 5200 + rooms * 150000 - age * 150000 + rng.normal(0, 600000, n)) / 100000
homes = pd.DataFrame({"area_sqft": area.round(), "rooms": rooms, "age_years": age, "price_lakh": price.round(1)})
sns.set_theme(style="whitegrid")
print(homes.describe().round(1).loc[["mean", "min", "max"]])
Output:
      area_sqft  rooms  age_years  price_lakh
mean     1409.0    2.6       14.8        79.9
min       534.0    1.0        0.0        16.6
max      2498.0    6.0       29.0       167.3
A made-up but realistic table of 150 homes: area, rooms, age and price.
scatterplot with hue#
fig, ax = plt.subplots(figsize=(7, 4))
sns.scatterplot(data=homes, x="area_sqft", y="price_lakh", hue="rooms", palette="viridis", ax=ax)
ax.set_title("Bigger homes cost more")
plt.show()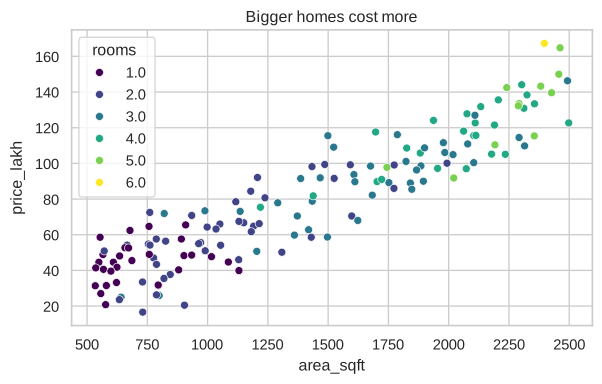
Colour (hue) adds a third column to a 2-D chart: you can see bigger homes also tend to have more rooms.
regplot: add the trend line#
fig, ax = plt.subplots(figsize=(7, 4))
sns.regplot(data=homes, x="age_years", y="price_lakh", scatter_kws={"alpha": 0.5}, line_kws={"color": "tab:red"}, ax=ax)
ax.set_title("Older homes are a little cheaper")
plt.show()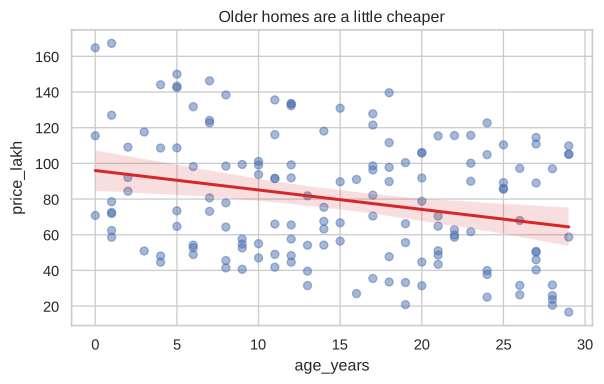
regplot fits a straight line through the points (a linear regression, which you’ll build yourself in the Machine Learning course). The shaded band shows the uncertainty.
Correlation heatmap#
Correlation is a number from -1 to 1 that measures how strongly two columns move together:
- close to 1: when one rises, the other rises;
- close to -1: when one rises, the other falls;
- close to 0: no straight-line relationship.
corr = homes.corr().round(2)
print(corr["price_lakh"])
Output:
area_sqft     0.92
rooms         0.81
age_years    -0.26
price_lakh    1.00
Name: price_lakh, dtype: float64
A heatmap shows the whole table as colours:
fig, ax = plt.subplots(figsize=(6, 4.5))
sns.heatmap(corr, annot=True, cmap="RdYlGn", vmin=-1, vmax=1, ax=ax)
ax.set_title("Which columns move together?")
plt.show()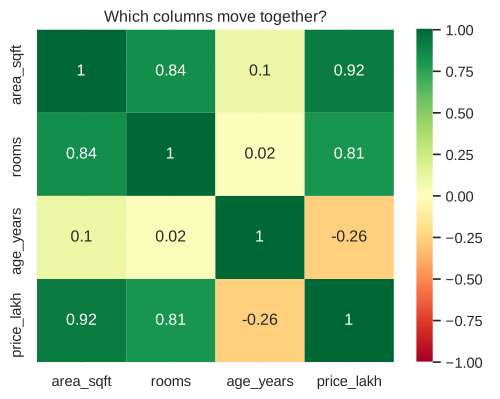
Area has the strongest link to price (0.92), and age a weak negative one (-0.26), so it would be the most useful input for a model predicting prices.
annot=True prints the numbers in each cell, and vmin=-1, vmax=1 keeps the colours honest so that 0.3 doesn’t look as strong as 0.9.
Mini dashboard#
Combine what you’ve learned into one figure you could put in a report:
fig, axes = plt.subplots(1, 3, figsize=(13, 3.8))
sns.histplot(homes["price_lakh"], bins=20, ax=axes[0])
axes[0].set_title("Price distribution")
sns.boxplot(data=homes, x="rooms", y="price_lakh", ax=axes[1])
axes[1].set_title("Price by rooms")
sns.regplot(data=homes, x="area_sqft", y="price_lakh", scatter_kws={"s": 12}, ax=axes[2])
axes[2].set_title("Price vs area")
fig.suptitle("Home prices at a glance", fontweight="bold")
fig.tight_layout()
plt.show()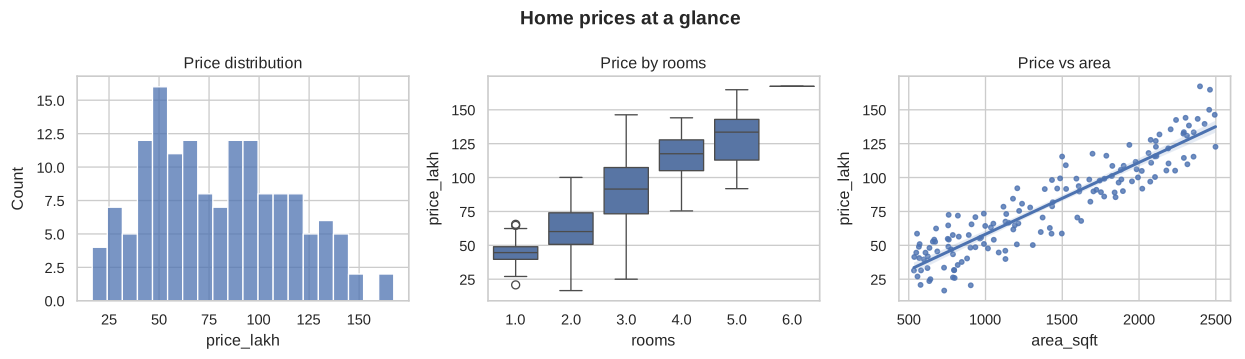
Next step
You’ve explored the data and found that area predicts price well. In the Machine Learning course, you’ll train a model that actually makes that prediction.
Summary#
sns.scatterplot(..., hue=...)shows a relationship plus a category.sns.regplotadds a trend line.df.corr()+sns.heatmap(annot=True)shows which columns move together.- Combine charts with
plt.subplotsfor a simple dashboard.
Quick quiz
3 questions. Check what stuck and earn 2 XP for each right answer.
Progress is saved in this browser. Create a free account to keep it on every device.
Get new lessons in your inbox
One email when we publish a new tutorial or guide. No spam, unsubscribe in one click.