Seaborn Basics
🎧 Focus sounds
Soft beat sounds that many learners like while reading. Pick one, press Play, and keep studying.
Keep the volume low. These sounds are for comfort while studying, not a medical treatment. If you have epilepsy or are sensitive to pulsing sounds, use the background noise only.
In this lesson
Seaborn sits on top of Matplotlib and speaks Pandas. You hand it a DataFrame and column names, and it does the grouping, averaging and colouring for you. Charts that take ten lines in Matplotlib take one.
pip install seabornWe’ll use this small dataset of students:
import numpy as np
import pandas as pd
import seaborn as sns
import matplotlib.pyplot as plt

rng = np.random.default_rng(3)
n = 120
df = pd.DataFrame({
    "course": rng.choice(["Python", "Java", "Web"], n, p=[0.45, 0.3, 0.25]),
    "gender": rng.choice(["Female", "Male"], n),
    "hours": rng.uniform(1, 12, n).round(1),
})
df["score"] = (40 + 4.5 * df["hours"] + rng.normal(0, 8, n)).clip(0, 100).round()
sns.set_theme(style="whitegrid")
print(df.head())
Output:
   course  gender  hours  score
0  Python  Female    6.7   66.0
1  Python    Male    2.8   67.0
2     Web  Female    5.9   59.0
3    Java    Male   10.6  100.0
4  Python    Male    7.2   72.0
sns.set_theme() switches on Seaborn’s clean default look for every chart after it.
countplot: how many in each category?#
fig, ax = plt.subplots(figsize=(7, 4))
sns.countplot(data=df, x="course", order=df["course"].value_counts().index, ax=ax)
ax.set_title("Python is our most chosen course")
plt.show()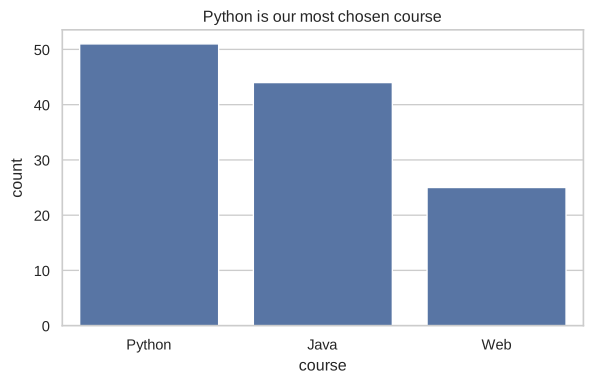
No value_counts, no loop: Seaborn counted the rows itself.
barplot: average per category#
fig, ax = plt.subplots(figsize=(7, 4))
sns.barplot(data=df, x="course", y="score", hue="gender", ax=ax)
ax.set_title("Average score by course and gender")
plt.show()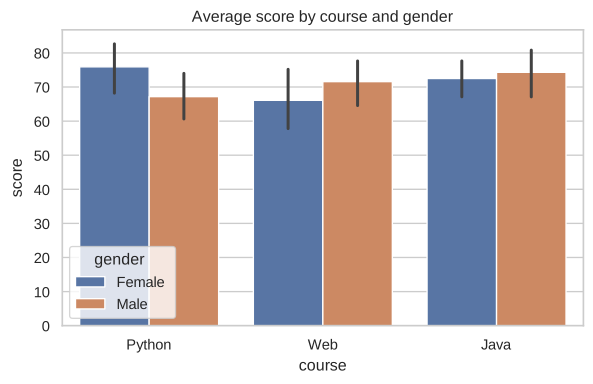
barplot shows the mean of y for each x, and hue splits each bar by a second category. The small black lines are error bars: how sure we are about each average. Long lines mean few students or very mixed scores.
histplot: distribution, optionally by group#
fig, ax = plt.subplots(figsize=(7, 4))
sns.histplot(data=df, x="score", hue="course", kde=True, element="step", ax=ax)
ax.set_title("Score distribution per course")
plt.show()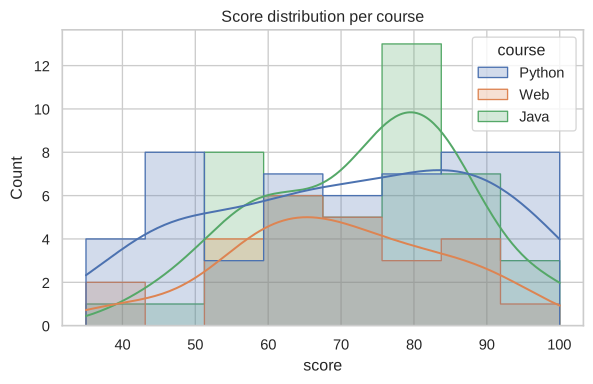
kde=True adds a smooth curve that estimates the shape, which is easier to compare than bars.
boxplot: spread and outliers at a glance#
fig, ax = plt.subplots(figsize=(7, 4))
sns.boxplot(data=df, x="course", y="hours", ax=ax)
ax.set_title("Weekly study hours per course")
plt.show()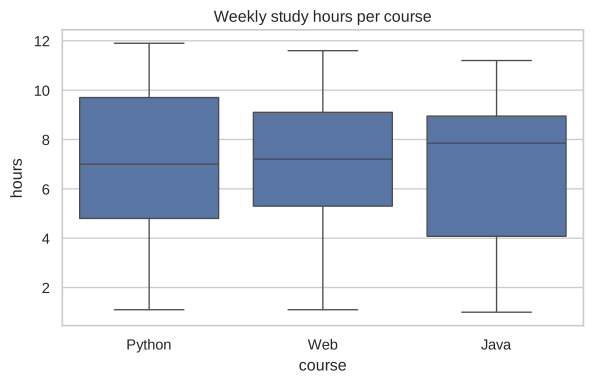
How to read a box:
- The line in the middle is the median.
- The box covers the middle 50% of students (from the 25th to the 75th percentile).
- The whiskers reach the rest of the normal range; dots beyond them are outliers.
Box plots are perfect for comparing groups when you have many values: you see the typical value, the spread and the unusual cases in one picture.
Quick check
Seaborn functions take data=df and column names as strings: x="course", not x=df["course"]. Both work, but the first gives automatic axis labels.
Summary#
| Question | Seaborn |
|---|---|
| How many per category? | sns.countplot |
| Average per category? | sns.barplot |
| How are values spread? | sns.histplot, sns.boxplot |
| Split by another category | add hue="column" |
Quick quiz
3 questions. Check what stuck and earn 2 XP for each right answer.
Progress is saved in this browser. Create a free account to keep it on every device.
Get new lessons in your inbox
One email when we publish a new tutorial or guide. No spam, unsubscribe in one click.