Line and Bar Charts with Matplotlib
🎧 Focus sounds
Soft beat sounds that many learners like while reading. Pick one, press Play, and keep studying.
Keep the volume low. These sounds are for comfort while studying, not a medical treatment. If you have epilepsy or are sensitive to pulsing sounds, use the background noise only.
In this lesson
Line and bar charts answer most everyday questions. This lesson shows how to make them clear: several lines with a legend, sorted bars, and labels on the bars so readers don’t have to guess.
Several lines with a legend#
Give each line a label, then call legend():
import matplotlib.pyplot as plt

months = ["Jan", "Feb", "Mar", "Apr", "May", "Jun"]
pune = [120, 135, 150, 145, 170, 190]
delhi = [140, 130, 125, 160, 165, 175]

fig, ax = plt.subplots(figsize=(7, 4))
ax.plot(months, pune, marker="o", label="Pune")
ax.plot(months, delhi, marker="s", linestyle="--", label="Delhi")
ax.set_title("Monthly orders: Pune overtook Delhi in May")
ax.set_ylabel("Orders")
ax.legend()
ax.grid(alpha=0.3)
plt.show()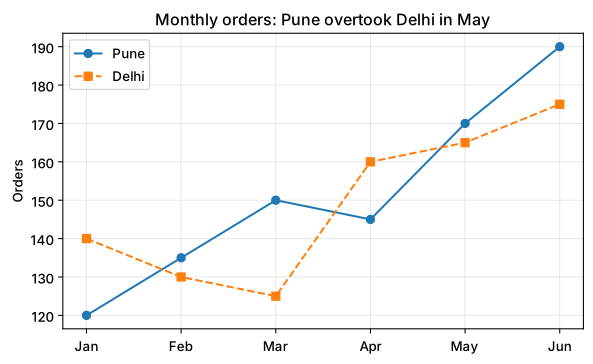
Useful styling options:
| Option | Examples |
|---|---|
marker | "o" circle, "s" square, "^" triangle |
linestyle | "-", "--", ":" |
color | "tab:green", "#0a7d4f" |
linewidth | 1, 2.5 |
Bar charts for categories#
import matplotlib.pyplot as plt

languages = ["Python", "JavaScript", "Java", "SQL", "C++"]
students = [420, 310, 280, 190, 120]

fig, ax = plt.subplots(figsize=(7, 4))
bars = ax.bar(languages, students, color="#0a7d4f")
ax.bar_label(bars)
ax.set_title("Most popular course among our students: Python")
ax.set_ylabel("Students enrolled")
plt.show()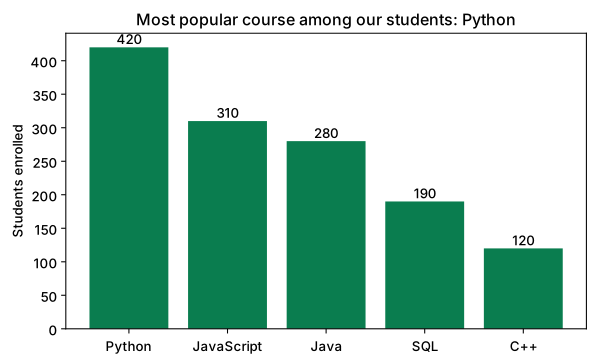
ax.bar_label(bars) writes each value on top of its bar, so nobody has to read the y-axis.
Sort bars from biggest to smallest (unless the categories have a natural order like months or age groups). Sorted bars are much faster to read.
Horizontal bars for long names#
When category names are long, turn the chart sideways with barh:
import matplotlib.pyplot as plt

topics = ["Data cleaning", "Exploratory analysis", "Feature engineering", "Model training", "Reporting"]
hours = [12, 8, 6, 4, 3]

fig, ax = plt.subplots(figsize=(7, 4))
ax.barh(topics[::-1], hours[::-1], color="tab:orange")
ax.set_title("Where a data project's time really goes")
ax.set_xlabel("Hours")
plt.show()
We reversed the lists with [::-1] so the biggest bar appears at the top.
Grouped bars#
To compare two series per category, shift each set of bars left and right by half a bar width:
import numpy as np
import matplotlib.pyplot as plt

subjects = ["Maths", "Science", "English"]
class_a = [72, 81, 77]
class_b = [78, 74, 83]
x = np.arange(len(subjects))
w = 0.38

fig, ax = plt.subplots(figsize=(7, 4))
ax.bar(x - w / 2, class_a, w, label="Class A")
ax.bar(x + w / 2, class_b, w, label="Class B")
ax.set_xticks(x, subjects)
ax.set_ylabel("Average marks")
ax.set_title("Class B leads in Maths and English")
ax.legend()
plt.show()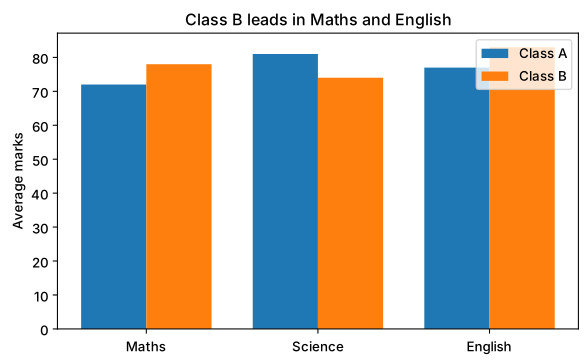
Quick check
Your y-axis starts at 70 instead of 0 and a small difference looks huge. For bar charts, always start the y-axis at zero, otherwise the bar heights lie.
Summary#
ax.plot()for trends; give each line alabeland callax.legend().ax.bar()for categories,ax.barh()for long names;ax.bar_label()adds values.- Sort bars, start bar axes at zero, and write the conclusion in the title.
Quick quiz
3 questions. Check what stuck and earn 2 XP for each right answer.
Progress is saved in this browser. Create a free account to keep it on every device.
Get new lessons in your inbox
One email when we publish a new tutorial or guide. No spam, unsubscribe in one click.