Histograms, Scatter Plots and Subplots
🎧 Focus sounds
Soft beat sounds that many learners like while reading. Pick one, press Play, and keep studying.
Keep the volume low. These sounds are for comfort while studying, not a medical treatment. If you have epilepsy or are sensitive to pulsing sounds, use the background noise only.
In this lesson
Line and bar charts summarise. Histograms and scatter plots show every data point, which is how you discover what the averages hide: two groups of students, an outlier, a relationship between two numbers.
Histograms: how are values spread?#
A histogram splits numbers into ranges (bins) and counts how many fall in each:
import numpy as np
import matplotlib.pyplot as plt

rng = np.random.default_rng(1)
marks = np.clip(rng.normal(68, 12, 300), 0, 100)

fig, ax = plt.subplots(figsize=(7, 4))
ax.hist(marks, bins=15, color="#0a7d4f", edgecolor="white")
ax.axvline(marks.mean(), color="tab:red", linestyle="--", label=f"mean = {marks.mean():.1f}")
ax.set_title("Most students scored between 55 and 80")
ax.set_xlabel("Marks")
ax.set_ylabel("Number of students")
ax.legend()
plt.show()
rng.normal(68, 12, 300) generates 300 realistic marks around 68. axvline draws a vertical line at the mean.
Try different bins values. Too few bins hide the shape; too many make it noisy. Between 10 and 30 is a good start.
Scatter plots: are two numbers related?#
Each dot is one row: x is one column, y is another.
import numpy as np
import matplotlib.pyplot as plt

rng = np.random.default_rng(7)
hours = rng.uniform(0, 10, 60)
score = 35 + 5.5 * hours + rng.normal(0, 7, 60)

fig, ax = plt.subplots(figsize=(7, 4))
ax.scatter(hours, score, alpha=0.7)
ax.set_title("More study hours, higher scores")
ax.set_xlabel("Hours studied per week")
ax.set_ylabel("Test score")
plt.show()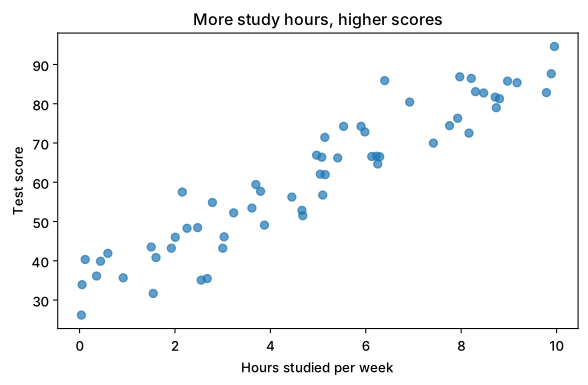
The dots go up from left to right: a positive relationship. alpha=0.7 makes dots slightly see-through, so overlapping points are visible. In the Machine Learning course you’ll fit a line through exactly this kind of data.
Careful
A relationship isn’t proof that one thing causes the other. Ice-cream sales and drowning both rise in summer; neither causes the other.
Subplots: several charts in one figure#
plt.subplots(rows, cols) returns a grid of axes. Draw each chart on its own ax:
import numpy as np
import matplotlib.pyplot as plt

months = ["Jan", "Feb", "Mar", "Apr", "May", "Jun"]
revenue = [42, 45, 39, 51, 58, 63]
orders = [310, 330, 290, 360, 400, 455]

fig, (ax1, ax2) = plt.subplots(1, 2, figsize=(10, 3.8))
ax1.plot(months, revenue, marker="o", color="tab:green")
ax1.set_title("Revenue (₹ lakh)")
ax2.bar(months, orders, color="tab:blue")
ax2.set_title("Orders")
fig.suptitle("First half of the year", fontweight="bold")
fig.tight_layout()
plt.show()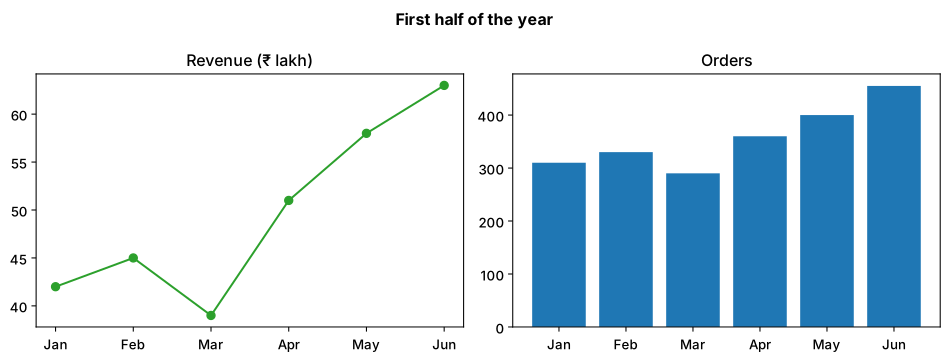
plt.subplots(1, 2): 1 row, 2 columns.fig.suptitle(): one title over the whole figure.fig.tight_layout(): stops labels from overlapping.
Summary#
ax.hist(values, bins=...)shows the spread of one column.ax.scatter(x, y)shows whether two columns move together.plt.subplots(r, c)gives a grid of axes for side-by-side comparisons.
Quick quiz
3 questions. Check what stuck and earn 2 XP for each right answer.
Progress is saved in this browser. Create a free account to keep it on every device.
Get new lessons in your inbox
One email when we publish a new tutorial or guide. No spam, unsubscribe in one click.